S3 method for class 'coleman'. plot.coleman creates a
plot for objects of class coleman, using the R base plotting framework.
# S3 method for coleman
plot(
  x,
  xlab = "Relative area (log transformed)",
  ylab = "Species richness",
  pch = 16,
  cex = 1.2,
  pcol = "black",
  cex.lab = 1.3,
  cex.axis = 1,
  lwd = 2,
  lcol1 = "black",
  lcol2 = "darkgrey",
  ModTitle = NULL,
  TiAdj = 0,
  TiLine = 0.5,
  cex.main = 1.5,
  ...
)
Arguments
| x | An object of class 'coleman'. |
|---|---|
| xlab | Title for the x-axis. |
| ylab | Title for the y-axis. |
| pch | Plotting character (for points). |
| cex | A numerical vector giving the amount by which plotting symbols (points) should be scaled relative to the default. |
| pcol | Colour of the points. |
| cex.lab | The amount by which the the axis titles should be scaled relative to the default. |
| cex.axis | The amount by which the the axis labels should be scaled relative to the default. |
| lwd | Line width. |
| lcol1 | Line colour of the fitted model curve. |
| lcol2 | Line colour of the model standard deviation curves. |
| ModTitle | Plot title (default is null, which equates to no main title). |
| TiAdj | Which way the plot title (if included) is justified. |
| TiLine | Places the plot title (if included) this many lines outwards from the plot edge. |
| cex.main | The amount by which the the plot title (if included) should be scaled relative to the default. |
| … | Further graphical parameters (see
|
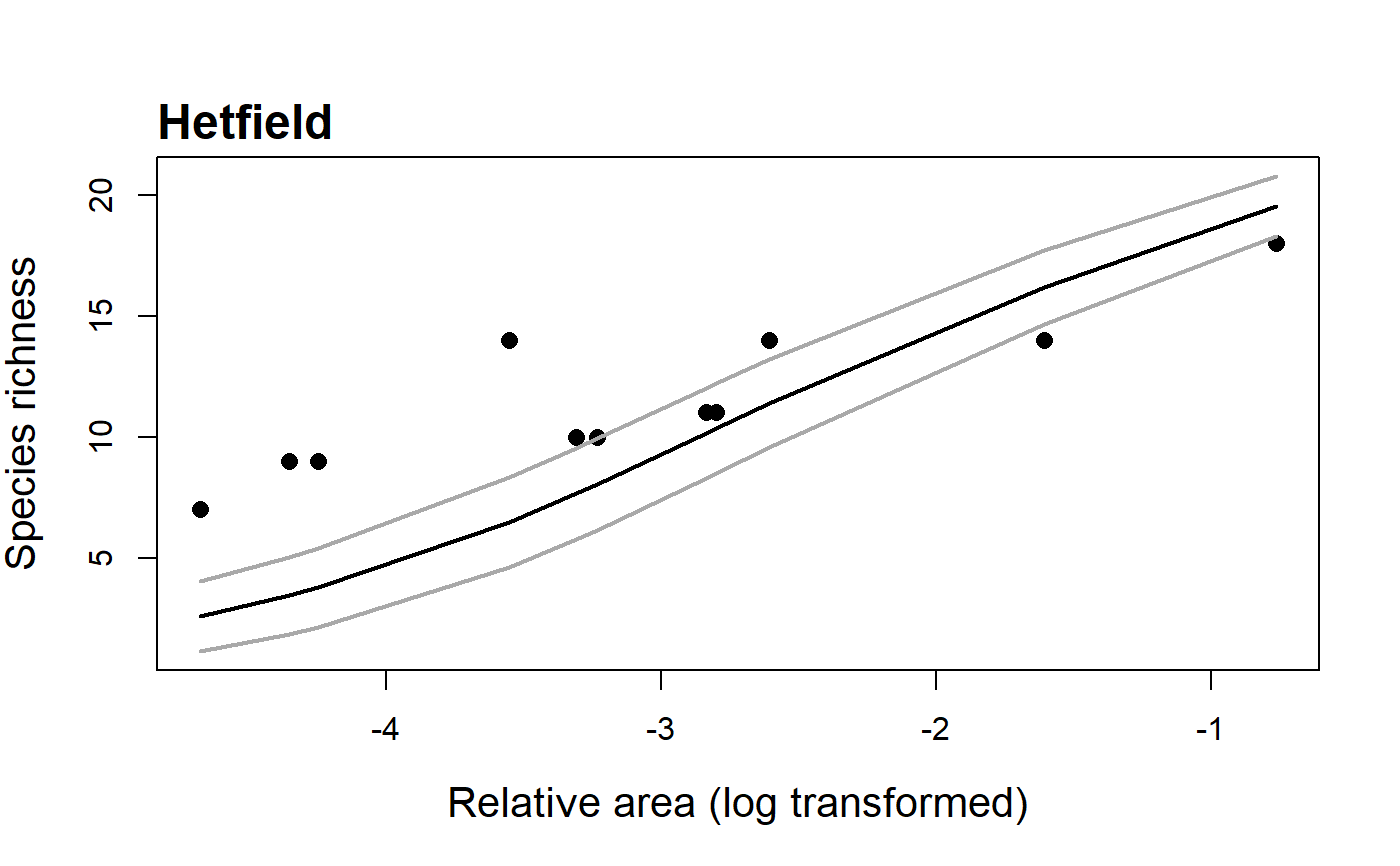
Details
The resultant plot contains the observed richness values with the model fit and confidence intervals. Following Wang et al. (2010), the model is rejected if more than a third of the observed data points fall beyond one standard deviation from the expected curve.